Where every project serves the strategy
A full project-management engine, governed by strategy.
Ryvato is one system for the objective and the work that delivers it. Projects are scheduled on the critical path and measured on earned value, and the results roll up — layer by layer — into health scores and the key results they serve.
The big picture
Strategy cascades down. Performance rolls up.
Every project sits in one team, every team in one unit, every unit in one organization — one parent each, so every number rolls up without ambiguity.
| Strategy cascades down (read from the top) | Performance rolls up (read from the bottom) |
|---|---|
| Strategic objectives | Strategic progress |
| Key results | Portfolio health |
| KPIs | Project and portfolio KPI performance |
| Projects | Time and cost progress & performance |
| Tasks | What was actually done |
How it works
Five domains. One platform.
Strategy & OKRs
Objectives and key results that read live from the work.
Example, in a demo organization: a linked project recovers from Warning to Healthy; the key result it feeds rises from 65% to 85%; the objective above it rises from 62% to 68%.
KPIs & KPI builder
Build a KPI. Report it. Read it for any period.
Example, in a demo organization: a monthly KPI, On-time delivery rate, is built with a target of 90% and an amber tolerance of 10%, and its monthly figures are reported. On its card, July reads 94%, achieved. Switched to the second quarter, the card shows the quarter's average, 91%.
The Ryvato Engine
Critical path and earned value, computed from the work itself.
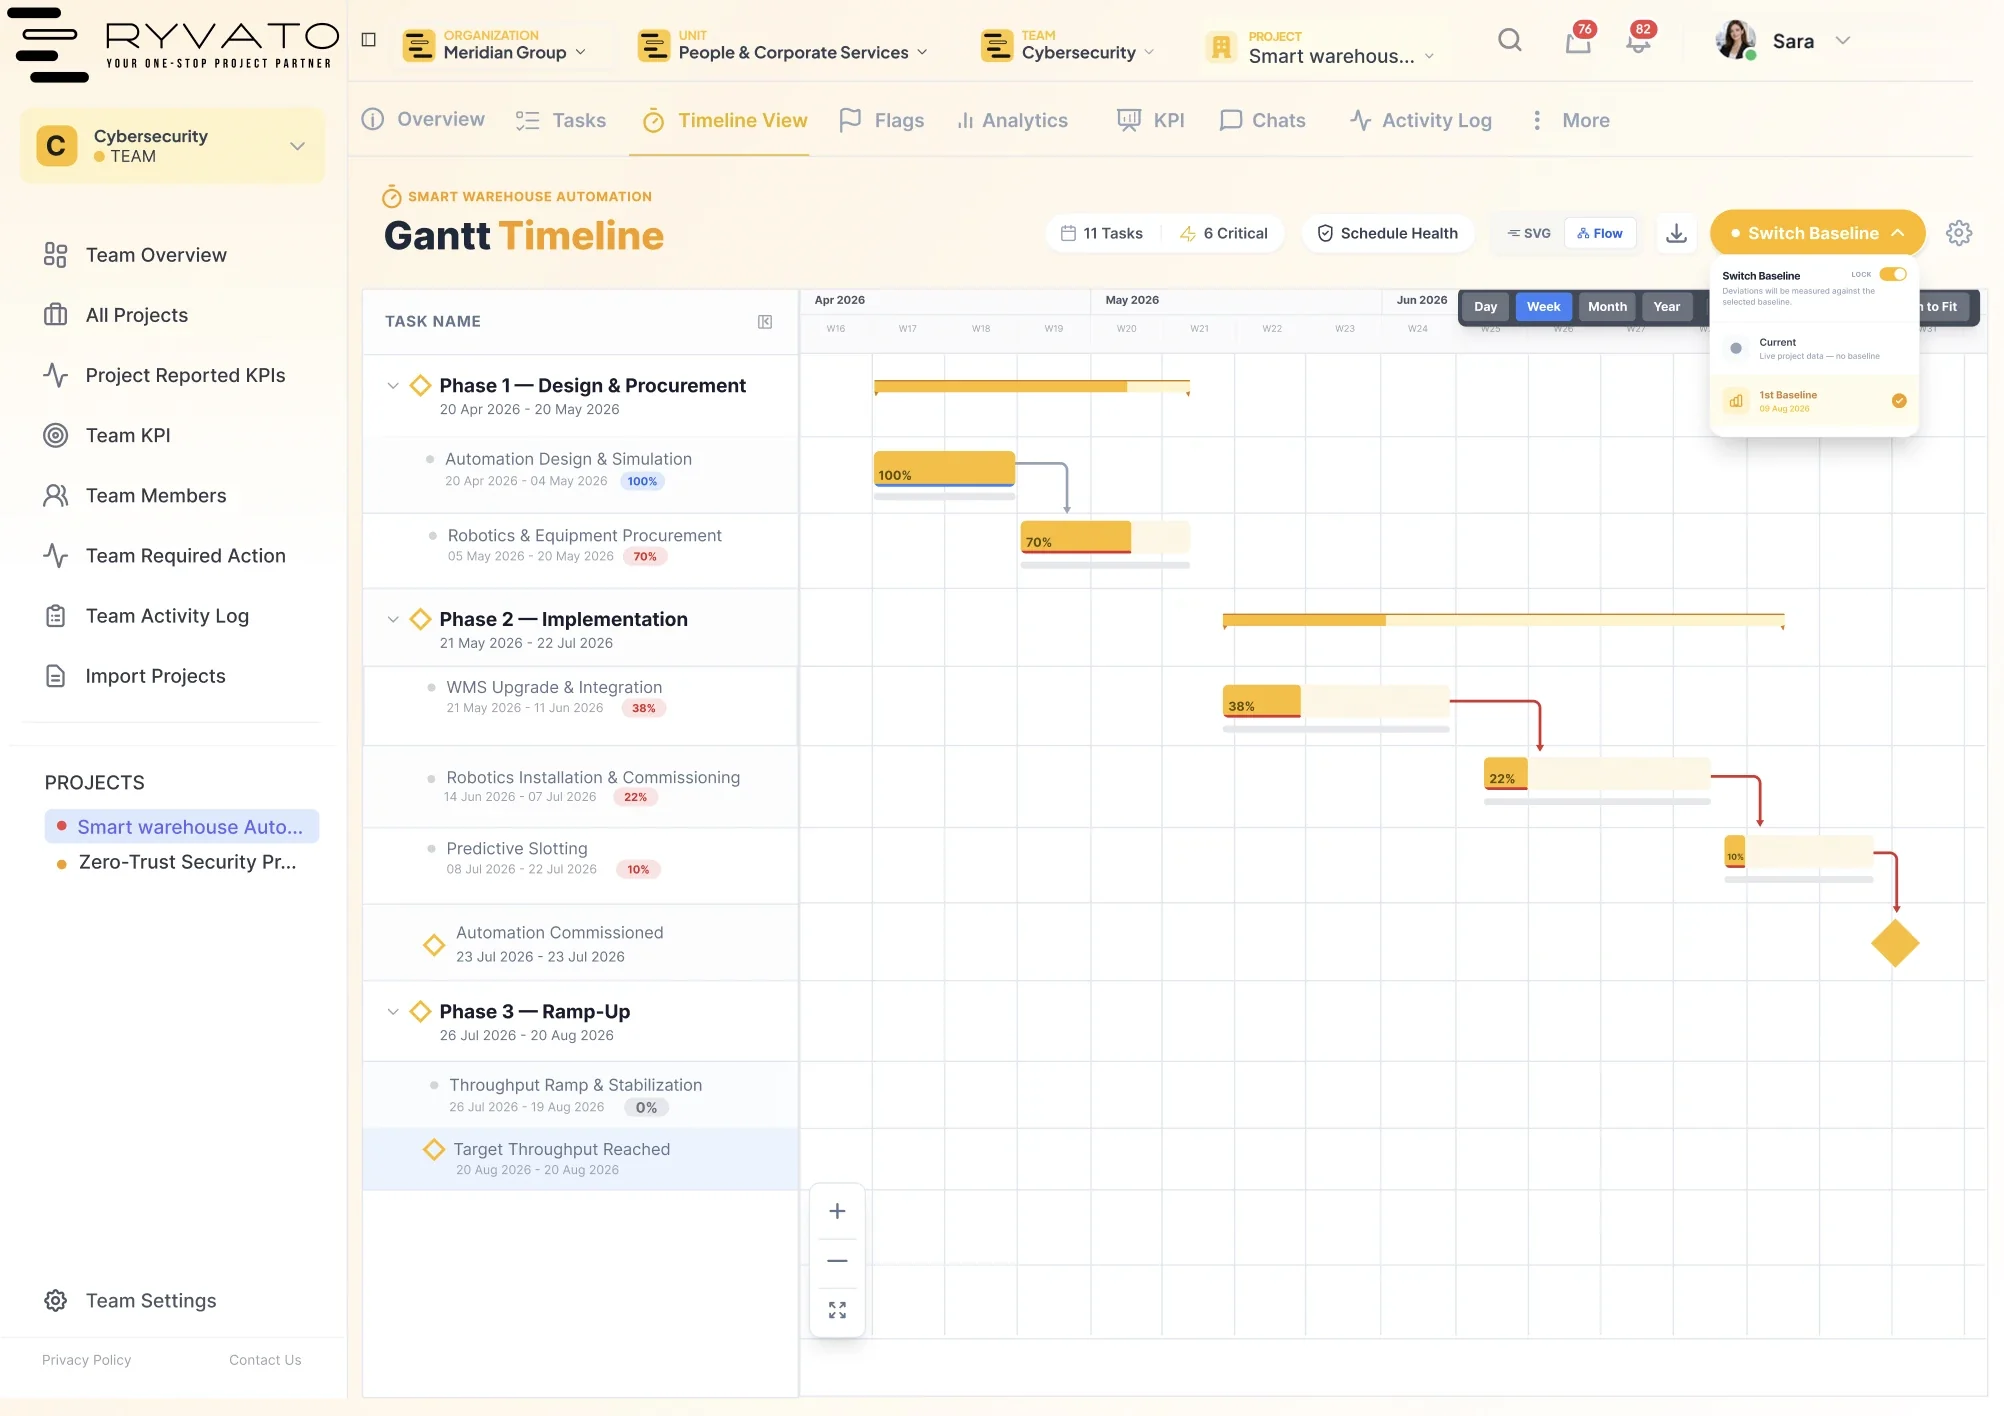
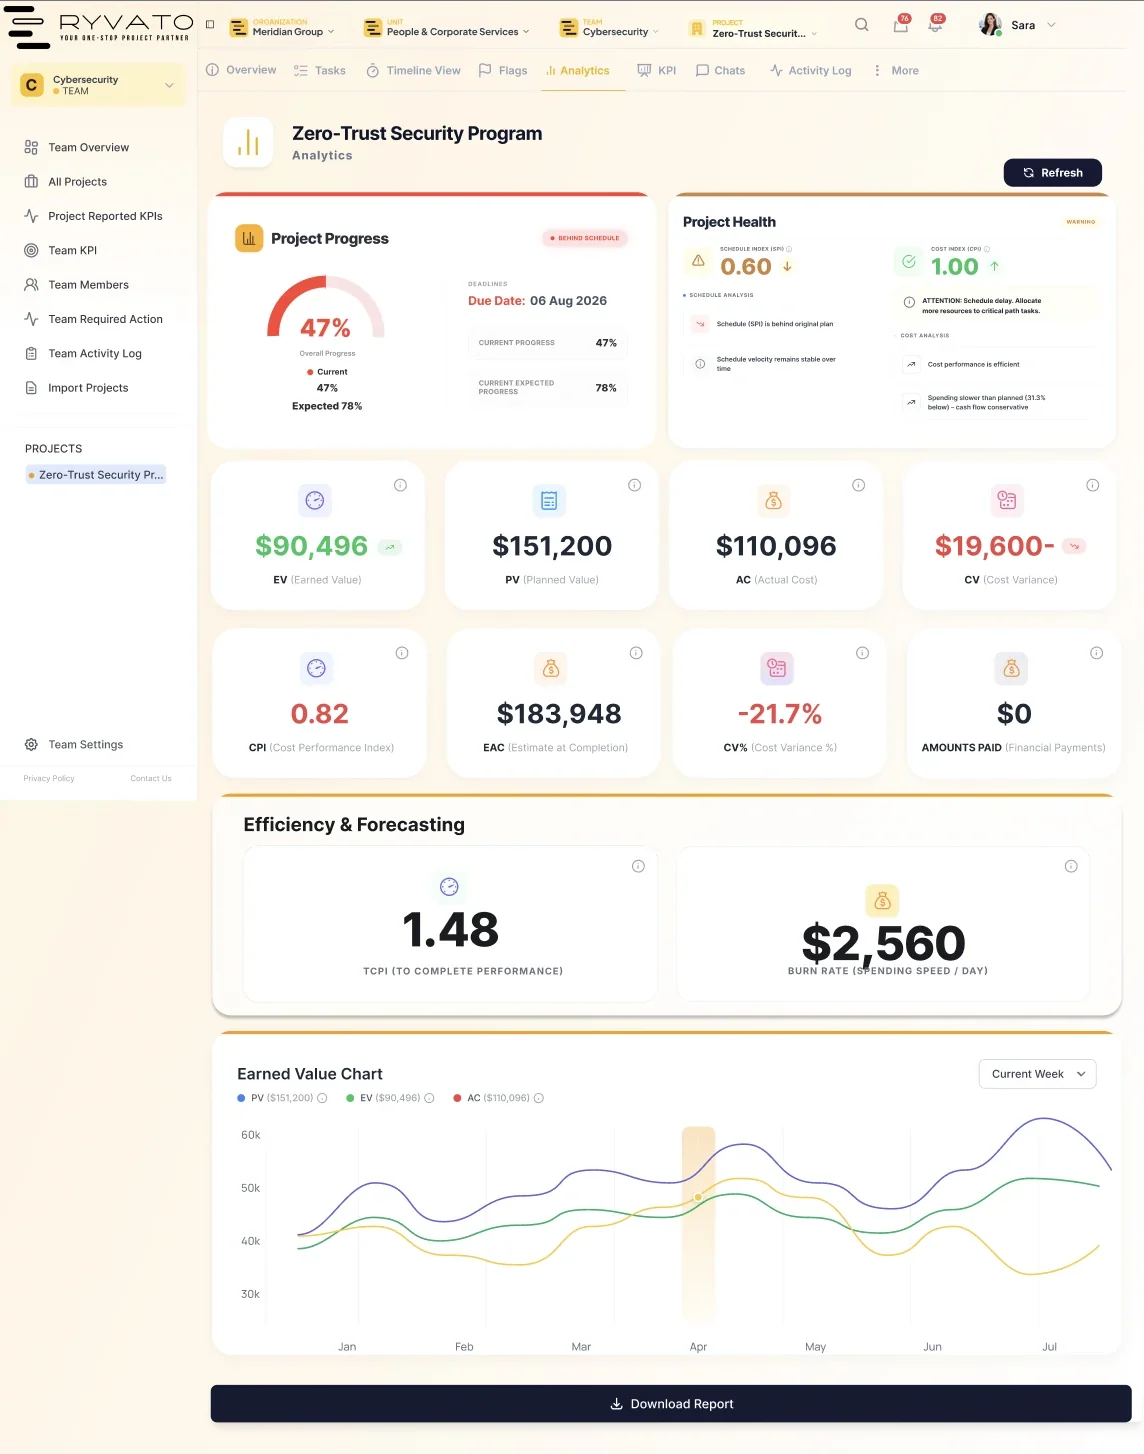
Example, in a demo organization: a project timeline shows its critical path, six of eleven tasks. The installation task ends a week later and every task that depends on it moves by a week on its own. Earned value is then read from the tasks: planned value $200,000, earned value $168,000, actual cost $180,000 — a schedule index of 0.84, a cost index of 0.93, and an estimate at completion of $428,571.
Health scoring
One number that tells the truth.
Example, in a demo organization. A project's schedule index is 0.62 and its cost index 1.10; their weighted average is 86%, which is Healthy, but because the schedule index is below 0.70 the project is downgraded to Warning. Its team's health combines KPIs (80%, weight 30%), projects (70%, weight 50%) and flags resolved (75%, weight 20%) into 74%, Warning. The same three pillars roll up to the unit (73%) and the organization (72%), with OKR progress in place of KPIs.
Flags & alerts
Every issue, escalation and risk, on the record.
Example, in a demo organization. An escalation is raised on a project; flag health — resolved flags divided by flags raised — falls at the team (75% to 71%), the unit (75% to 72%) and the organization (80% to 77%). A member marks an issue resolved and the project manager approves it; flag health rises to 76%, 76% and 81%. Flags count for 20% of health at each layer, so team health goes 74% → 73% → 74%, unit 73% → 72% → 73%, and organization 72% → 71% → 72%.
Methods
Four methods, applied in Ryvato.
01Critical path
PMI's Practice Standard for Scheduling.
02Earned value
PMI's Practice Standard for Earned Value Management.
03Objectives
The OKR framework.
04KPIs
KPIs: targets, tolerance and periods.
Contact
Strategy, PMO or projects: tell us what's not working.
Tell us the problem. We'll show you how Ryvato solves it, on a demo organization.
Which one is yours?
Start a conversation
What happens next
The person responsible reads it, and you have a reply within one to two working days.
Then, if it fits, a walkthrough of Ryvato on a demo organization.
Already using Ryvato? Sign in (opens in a new tab), or write to support@ryvato.com.